Learning Programs
The Learning Programs section in the Rawam platform is essential for creating educational content aimed at raising awareness and knowledge, particularly in fields such as cybersecurity. This section enables administrators to create comprehensive training programs, which include courses, educational topics, and assessments, ensuring a well-organized and trackable learning experience.
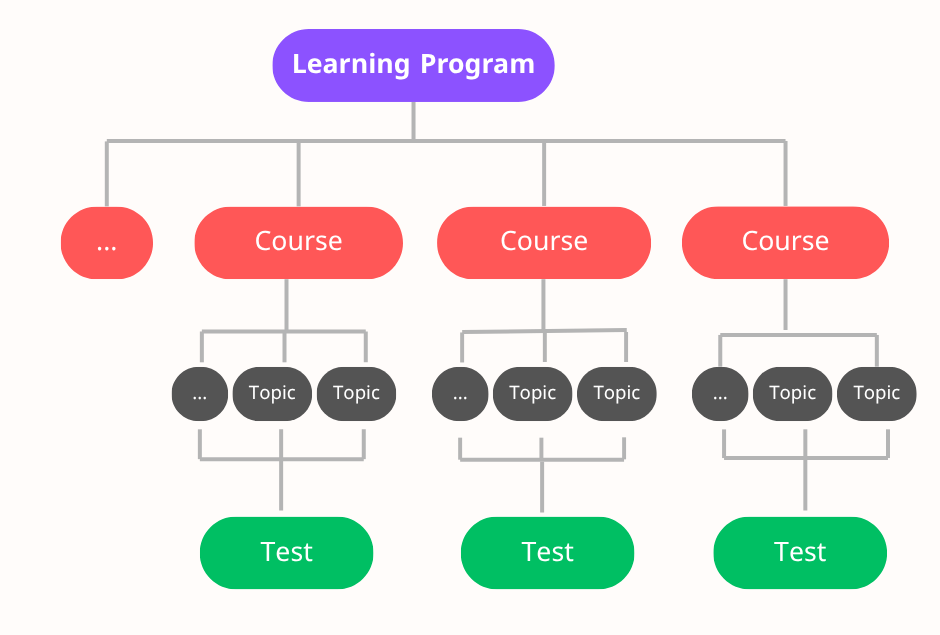
Learning Program Components (as shown in the image)
The image illustrates the hierarchical structure of a training program, which consists of:
- One Learning Program (Top Level)
- This is the general framework that encompasses all the courses, topics, and assessments for a specific training subject.
- Multiple Training Courses within the program (Second Level)
- Each course represents a module or section of the program, built around a specific set of topics.
- Multiple Educational Topics within each course (Third Level)
- These represent the knowledge content or units that the trainee must review.
- Final Test at the end of each course (Fourth Level)
- This measures the trainee's understanding of the topics and determines their success or failure in the course.
Learning Program Management
This screen provides the Training Program Management interface in the Rawam platform, allowing system administrators to manage all created training programs. It also provides a way to monitor general statistics related to user interaction with the programs.
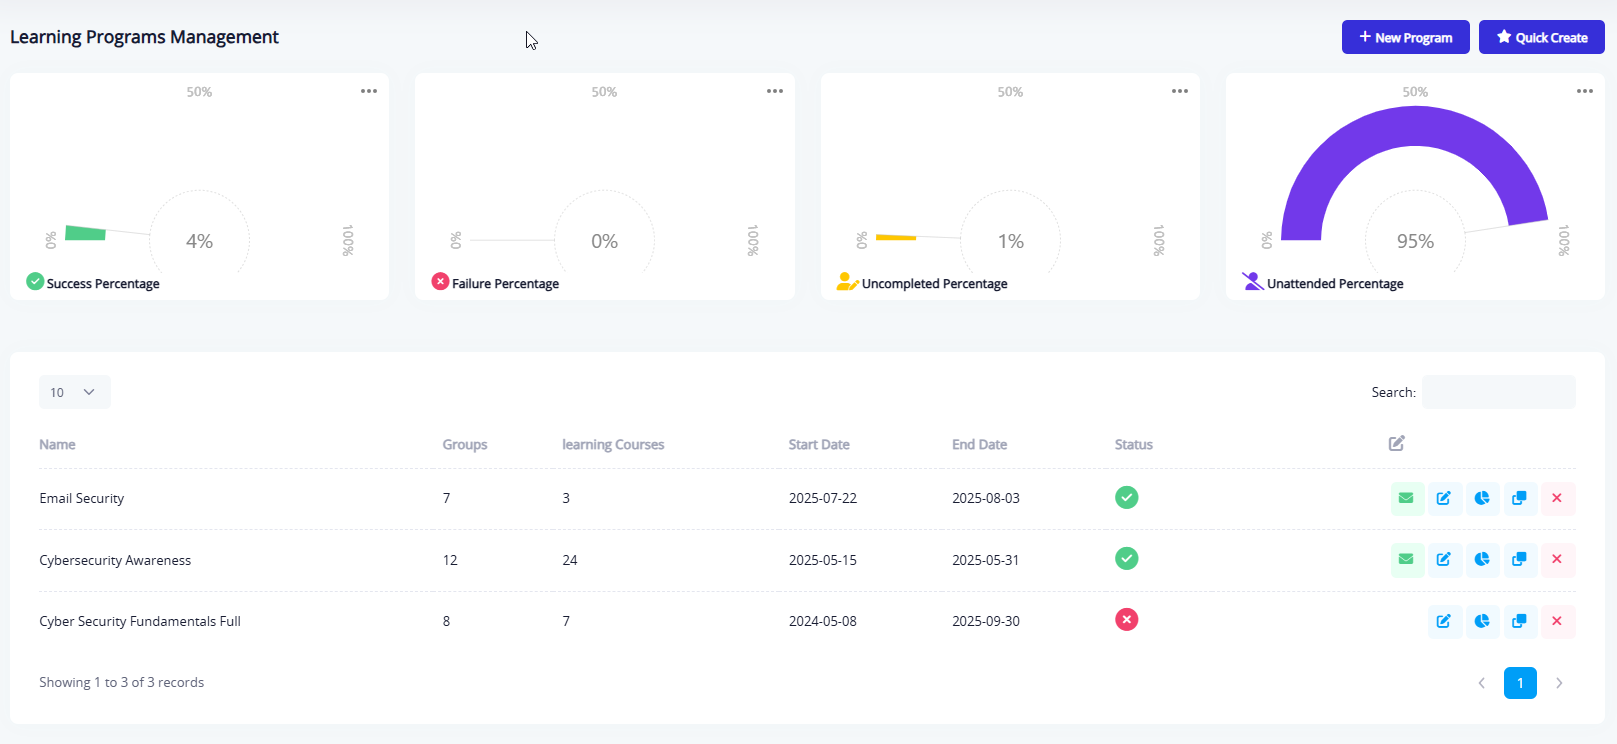
Detailed Explanation of the Screen Elements:
Top Statistics
At the top of the Training Program Management screen, a set of indicators is displayed, allowing administrators to track participants' performance in the training programs. These indicators include:
- Unattended Percentage: Represents the percentage of users registered for the program but did not begin participation. In this case, the rate is 93%.
- Uncompleted Percentage: Represents users who started the program but did not complete all requirements. The displayed rate is 3%.
- Failure Percentage: Represents users who completed the program but did not pass the final test. The current rate is 0%.
- Success Percentage: Reflects the percentage of participants who completed the training program and passed the assessment. The displayed rate is 4%.

Learning Program Table
At the bottom of the page, a table displays a list of all training programs registered in the system. Each row represents a single training program, and the table includes the following columns:
- Program Name: e.g., "Cybersecurity Awareness Program."
- Departments: The number of departments or units associated with the program.
- Training Courses: The number of courses within the program.
- Start Date: The actual date the program begins.
- End Date: The date the program concludes.
- Status: Indicates whether the program is active and receiving participants or not.

Learning Program Management Tools
Next to each program in the table, there are several options that allow the administrator to take specific actions on the program, such as:
- Deleting the training program.
- Viewing detailed reports related to the program.
- Creating a copy of the program with all details.
- Editing program data.
- Sending notifications to participants associated with the program.
Learning Program Creation Tools
At the top of the screen, two options are available for creating training programs:
-
Create New Program: This option allows you to enter program details only, without creating courses or topics directly. After saving, the program can be completed later by going to the "Topics Management" section to add course content, and the "Question List" section to enter test questions for each course.
-
Quick Create: This option allows you to create the full training program in a step-by-step process within the same form, as follows:
- Step 1: Enter program details (name and description).
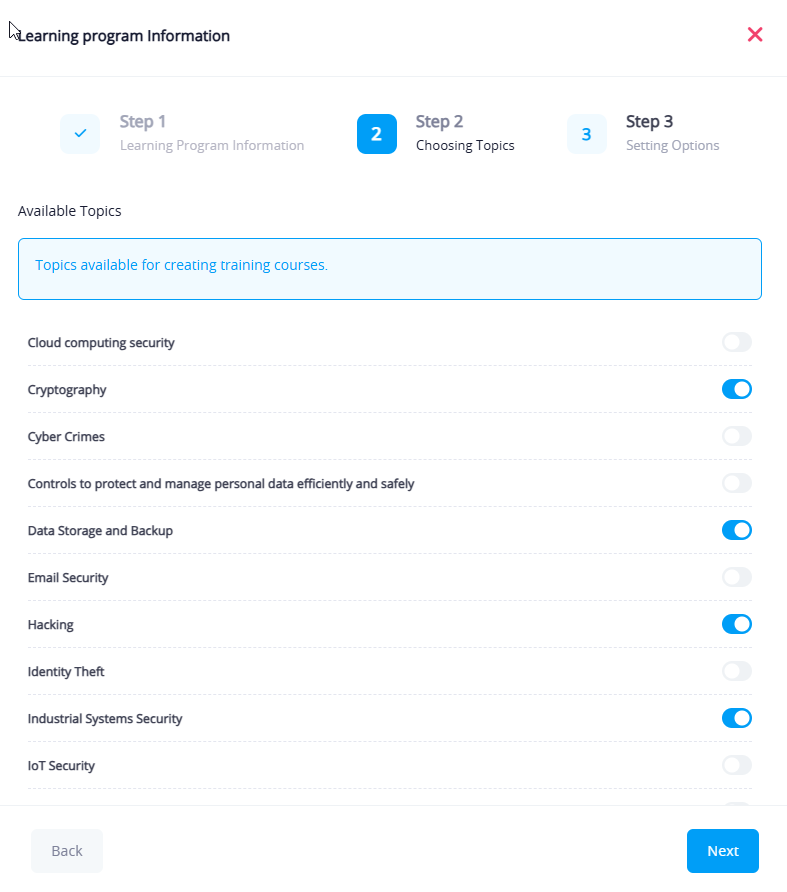
- Step 2: Choose topics related to the course.
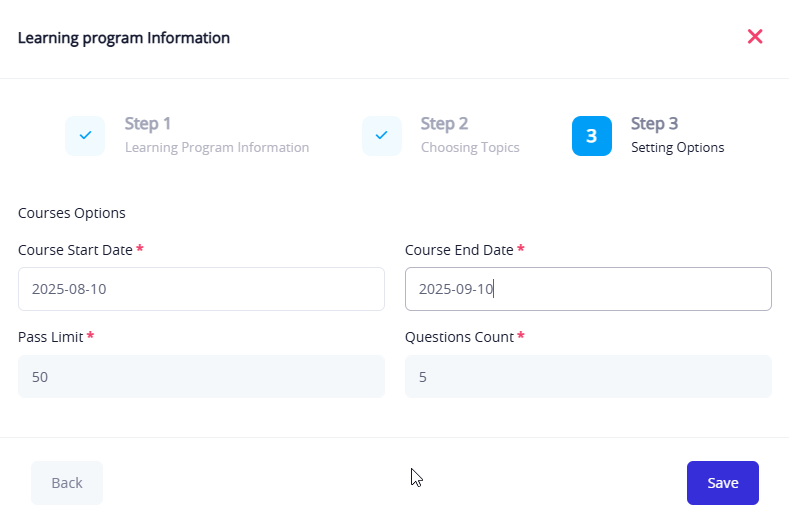
- Step 3: Set the number of questions and start/end dates.
These steps are outlined in the document below.
Steps to Create a Program
To create a new training program, follow these steps:
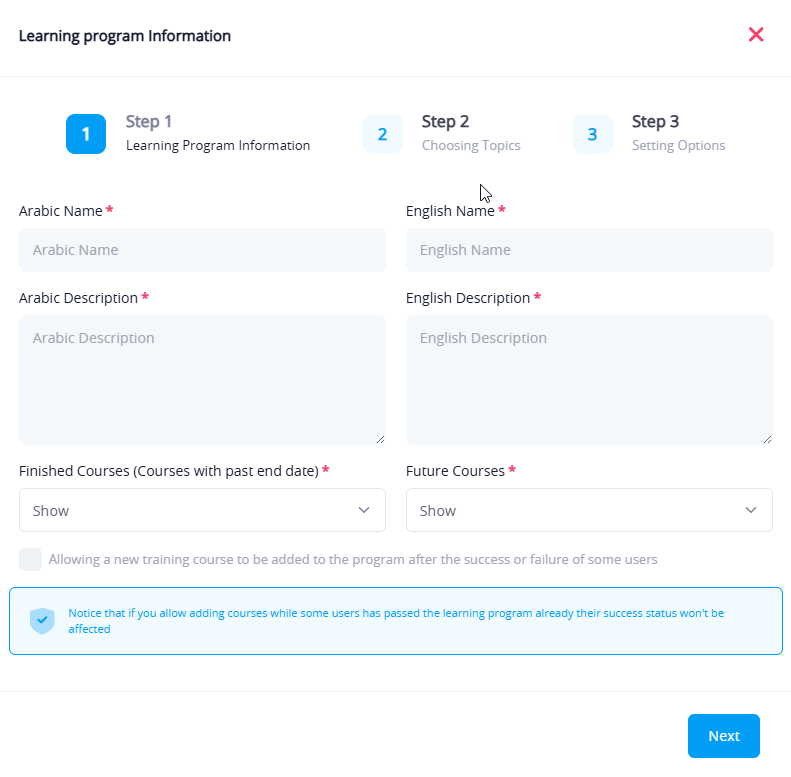
Step 1: Program Information
- Enter the program name and description (in both Arabic and English).
- Specify how to handle completed and future courses (whether they should be shown or disabled).
- Advanced options such as allowing users to retake the test if they fail.
Step 2: Choose Topics
- Available educational topics are selected and converted into one or more training courses within the program.
- Each set of topics represents an independent course.
Step 3: Define Course Settings
- Assign the number of questions for each final test.
- Set the passing rate.
- Select the start and end dates for the training program.
Real-World Example:
Let's assume we have a learning program titled "Cybersecurity Awareness", which could contain:
- Course 1: Information Security
- Topics: Email security, Encryption, Identity theft
- Final Test
- Course 2: Device Security
- Topics: Mobile security, Data protection, Network security
- Final Test
In this case, the user would progress through the stages and be evaluated at the end of each course independently.
Learning Program Reports
The Program Reports section provides a comprehensive dashboard to monitor and analyze the performance of training programs implemented on the platform. This section allows administrators to track completion rates, trainee results, review course and survey details, and print certificates. It is designed to offer flexible and organized analysis of training outcomes and evaluate the program's effectiveness in achieving its goals.
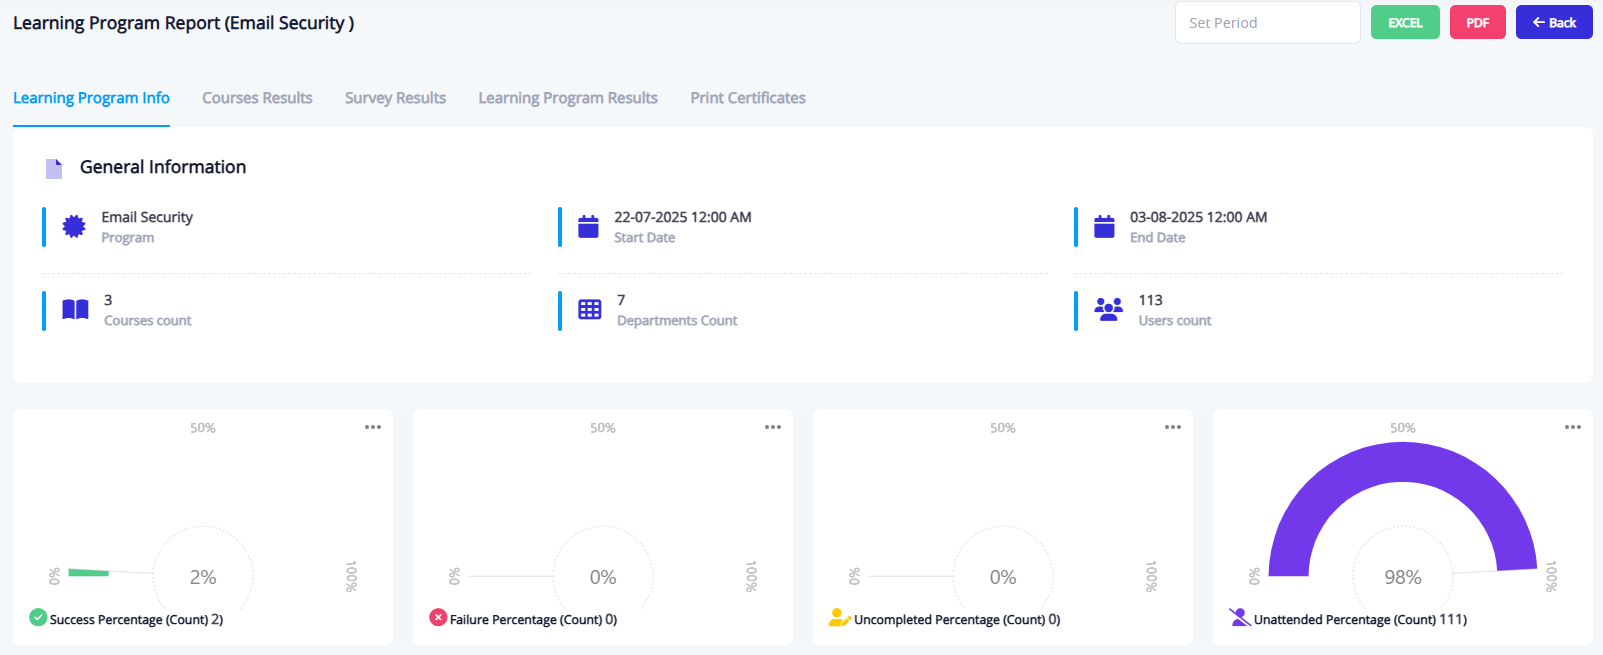
Learning Program Info
This tab provides a general summary of the training program, including:
- Program name, start and end dates
- Number of participating departments and linked courses
- Number of users registered
- Visual statistics showing absence rates, incomplete rates, failure rates, and success rates
Course Results
This tab displays detailed statistics for each course within the training program, including:
- Course name, start and end dates
- Number of topics included in the course
- Number of trainees, with breakdowns of successful, failed, and absent users
- Admins can click the "View" button to open details for each course.
- Graphs and charts are also available summarizing attendance, success, and incomplete rates.

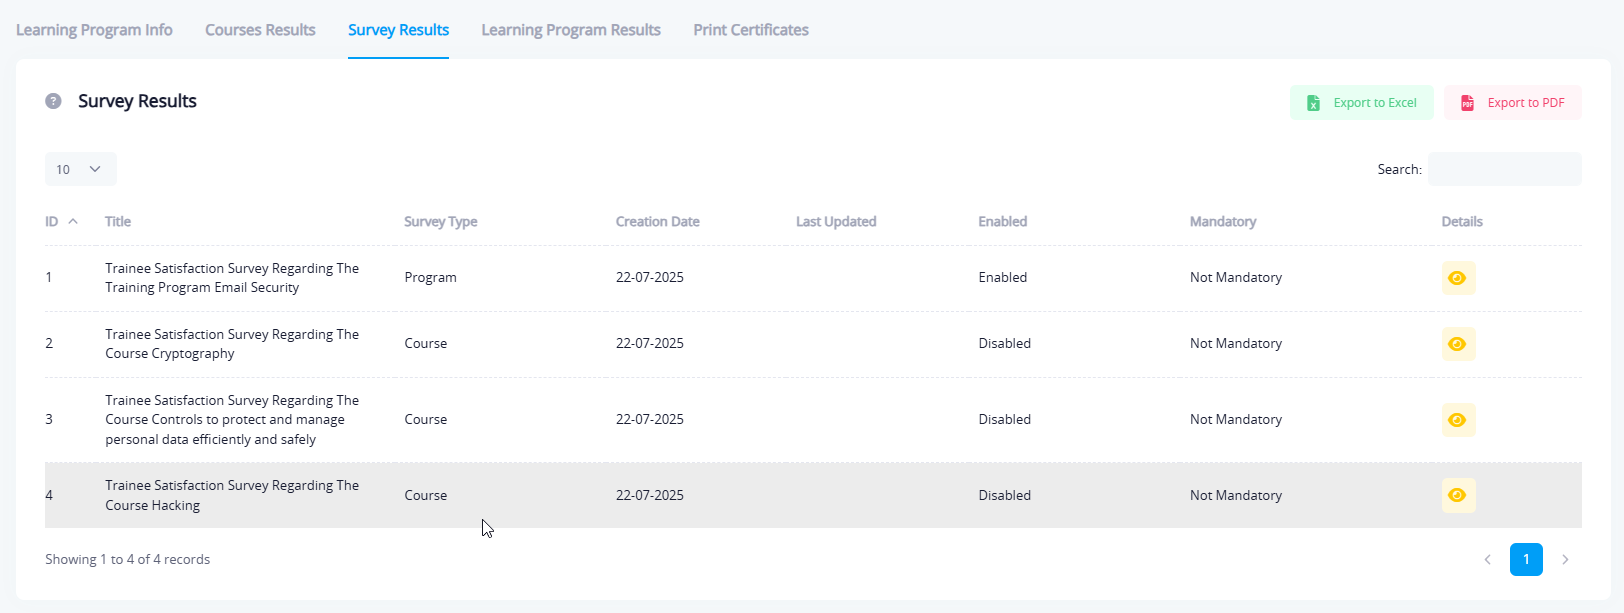
Survey Results
This tab shows all surveys linked to the courses or the overall training program, including:
- Survey title
- Type (Course or Program)
- Survey status (Active or Inactive)
- Whether it's mandatory
- Creation and modification dates
- Admins can view survey results by clicking the "View Details" button.
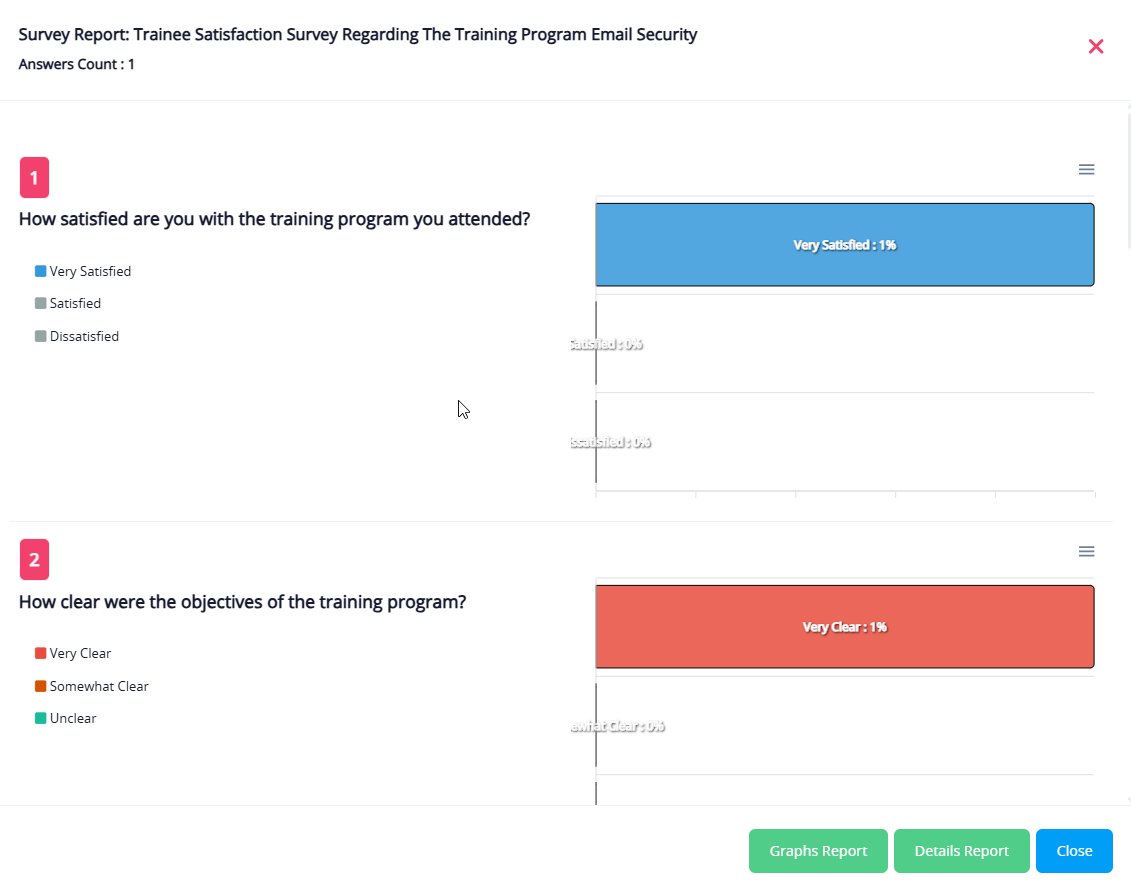
View Survey Results
When opening a survey, the results for each question are displayed graphically. These include:
- Distribution of answers for each question
- Options to download the graphical report as a PDF or the detailed report as an Excel file
Learning Program Results (Trainee List)
This tab displays a list of all trainees registered in the Learning program, with the option to filter results by:
- Successful users
- Failed users
- Incomplete users
- Absent users
For each trainee, their name, department, and email are shown, and the list can be exported as an Excel or PDF file.

Print Certificates
This tab allows the admin to view a list of successful trainees and provides flexible tools to download certificates in bulk. The list contains the following information for each trainee:
- Username
- Full name
- Email address
- Department
- Test completion date
The admin can select a group of users to extract their certificates or export their names in a formatted table. The final step is to download a PDF file containing the certificates or the requested data.

Test Reports
This section provides detailed reports on trainees' performance in assessments. The report is divided into several tabs, allowing administrators to analyze performance results precisely. The sections are as follows:
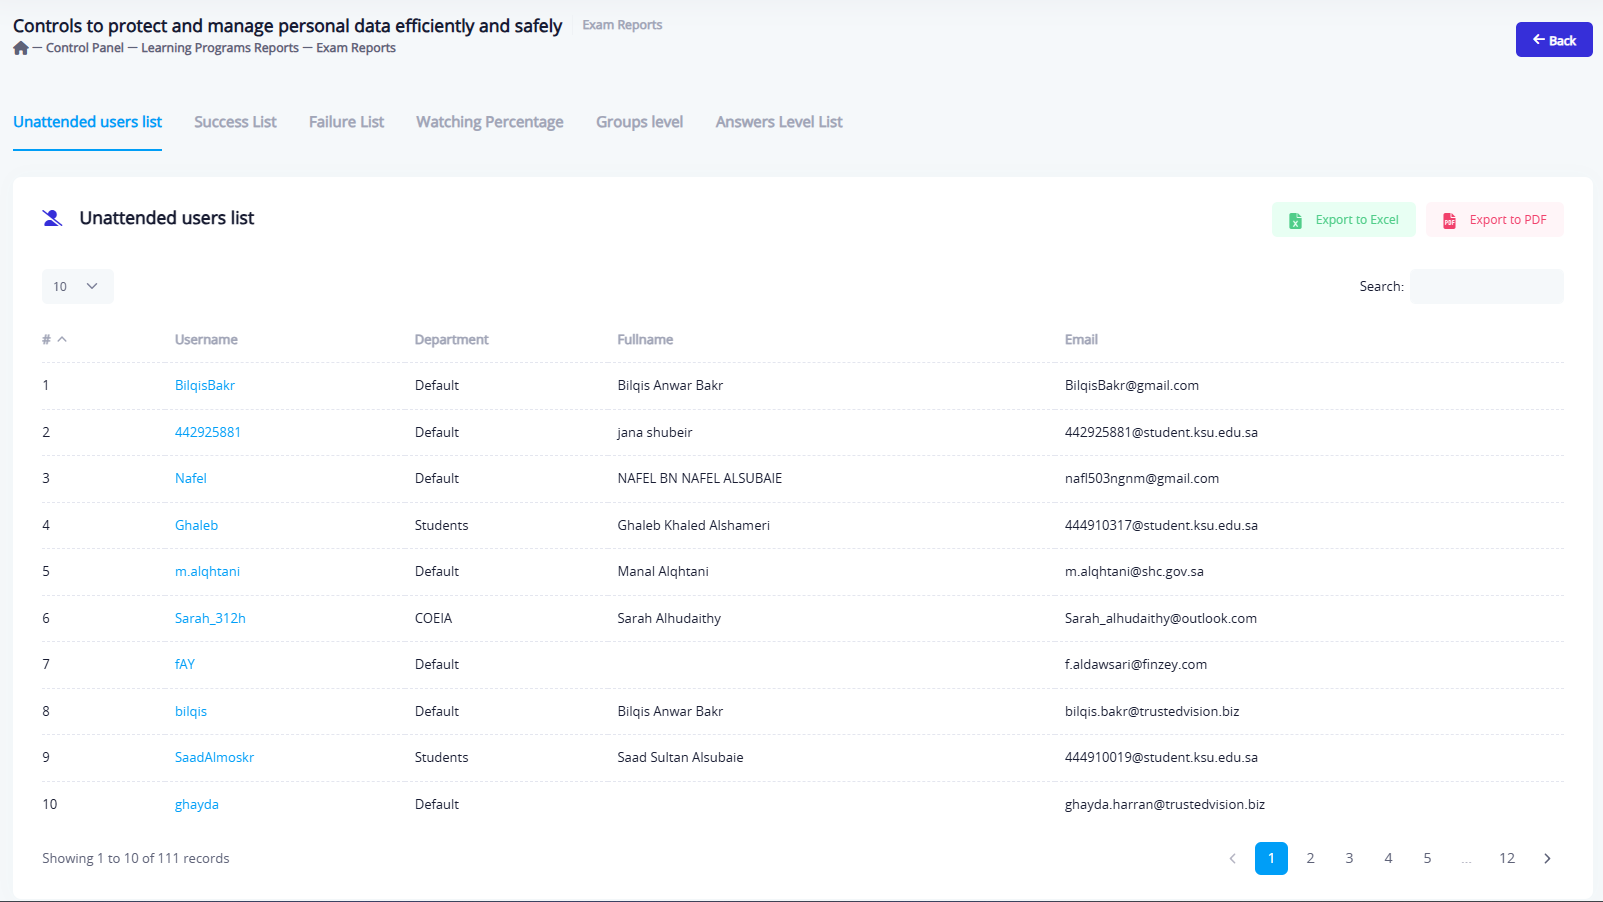
Unattended Users List
This tab displays a list of users who did not attend the test. For example, in the "IoT Security" test, the following information is shown:
- Username
- Department
- Full name
- Email address
You can export this list in either PDF or Excel formats.
Success List
This section displays all trainees who passed the test successfully. The table includes the following information:
- Username
- Department
- Full name
- Email address
- Test date
- Score achieved
There is an option to export the data in either PDF or Excel formats.

Failure List
In case of failed trainees, they are displayed in this tab with their personal data and results. If there are no failed trainees, a notification will appear stating that there are no entries in the system.
You can export this data in either PDF or Excel formats.

Watching Percentage
This tab displays the percentage of test content viewed by trainees, helping to understand their engagement with the training material. It includes:
- Username
- Department
- Full name
- Email address
- Percentage of content viewed
An option to export the data in PDF or Excel formats is available.

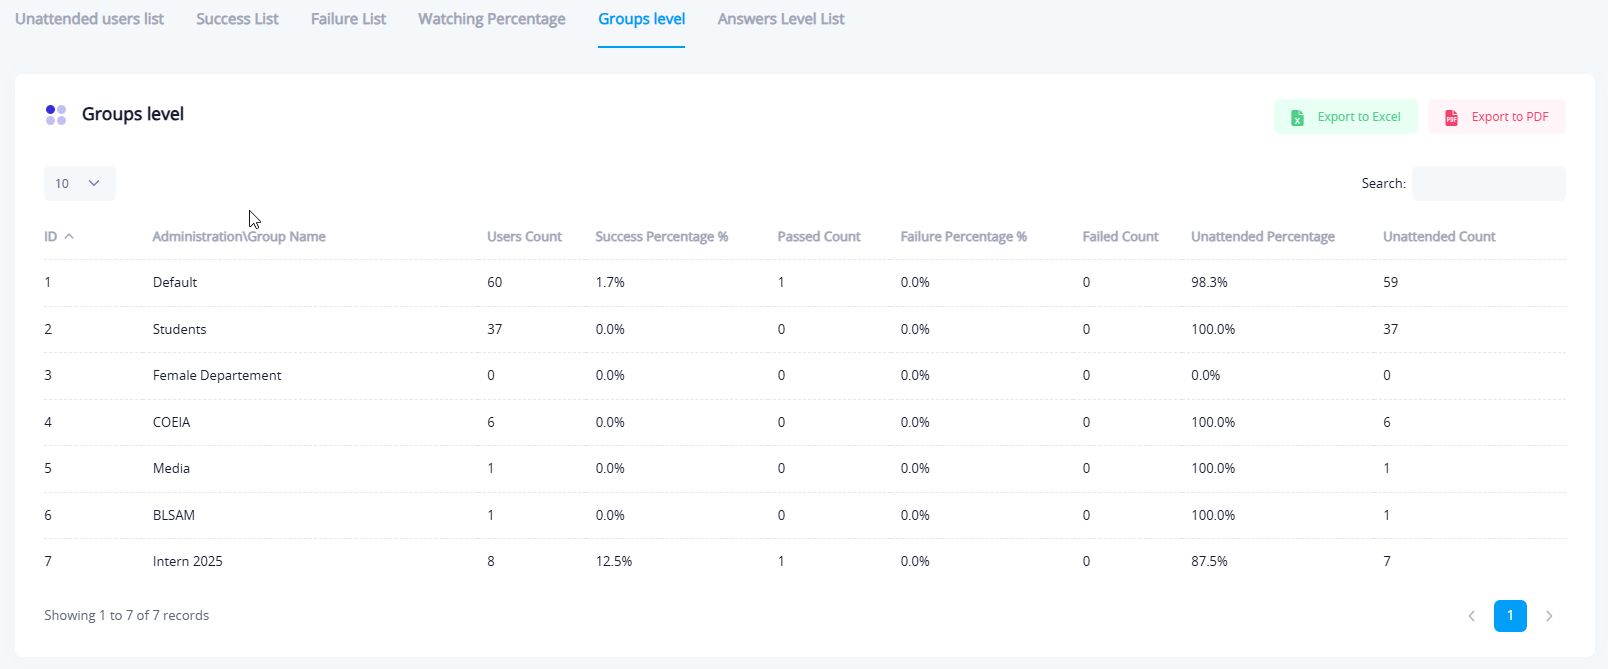
Groups Level
This tab shows a breakdown of departments based on their employees' performance in the test. Key metrics include:
- Number of users
- Number of successful users
- Number of failed users
- Number of no shows
- Success rate
- Failure rate
- Absence rate
You can export the data in PDF or Excel formats.
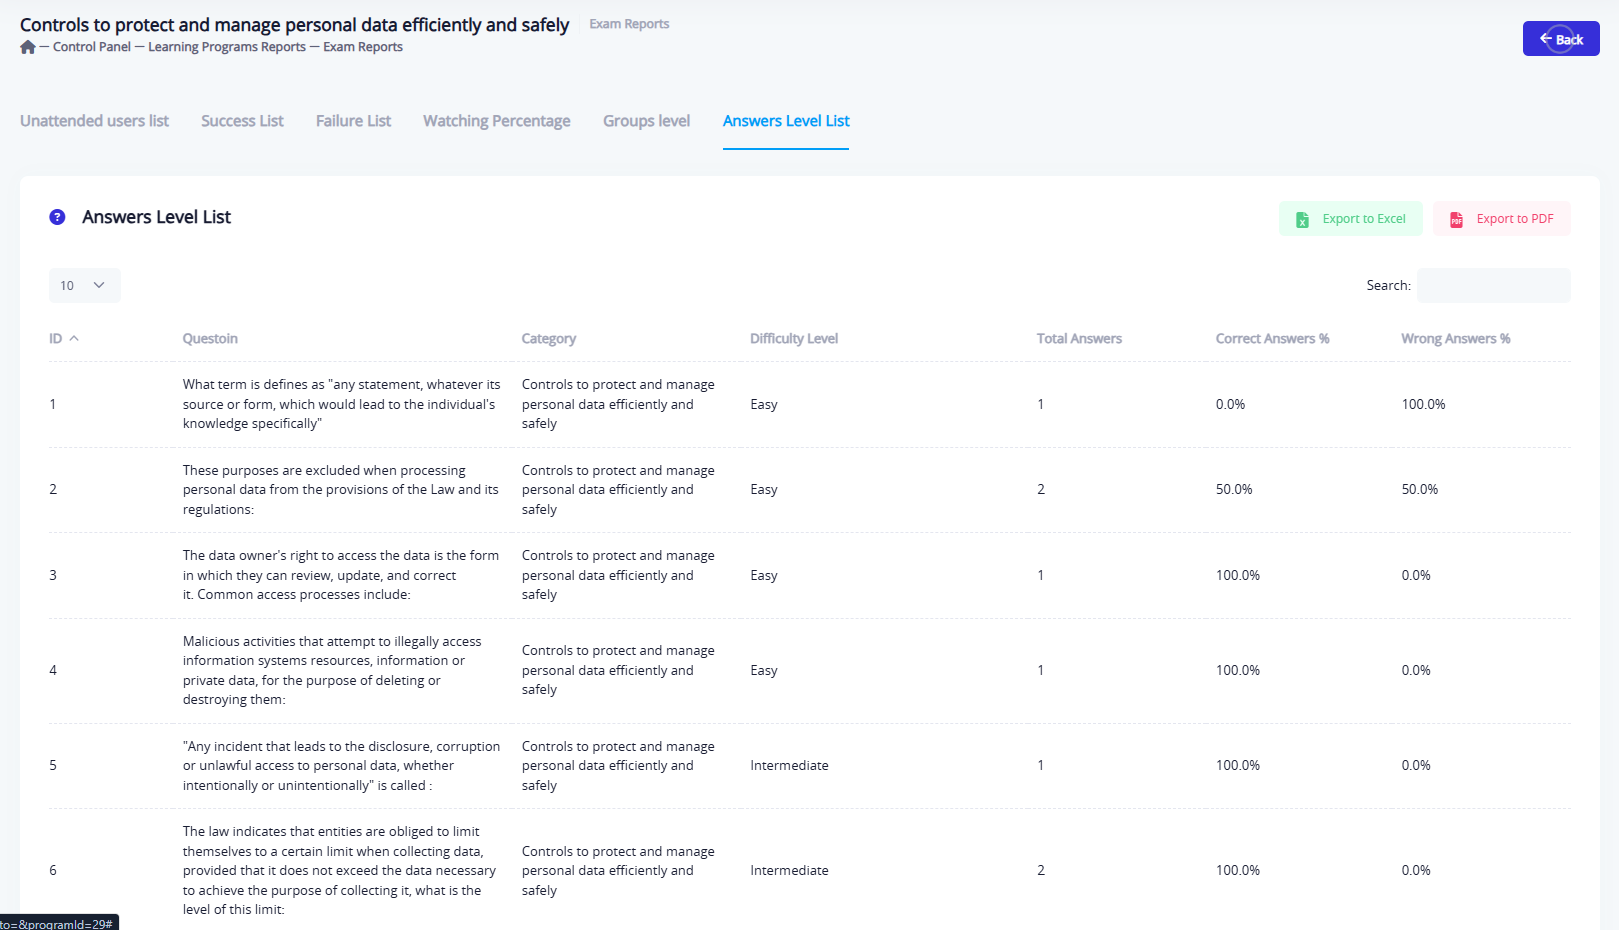
Answers Level List
This tab provides a detailed analysis of trainees' performance at the question level, displaying:
- Question text
- Classification (e.g., IoT Security)
- Difficulty level (Easy, Medium, Hard)
- Number of answers
- Percentage of correct answers
- Percentage of incorrect answers
There is an option to export the data in PDF or Excel formats.
