Survey Management Screen
The Survey Management screen allows administrators to create and track user-targeted surveys, whether they are general or department-specific. Once a new survey is added, its details appear in the main table as shown in the image.

Elements Displayed on the Screen:
- "New Survey" Button (top left): Used to create a new survey through a 3-step process (Info – Settings – Questions).
- Enable Surveys Feature: A toggle to activate/deactivate the survey module system-wide.
- Show General Surveys Only: Filters the list to display only surveys marked as "General."
- Survey Table: Displays the survey title, type, creation date, last modified date, status, whether it's mandatory, and action buttons.
Survey-Specific Action Buttons (Far Left):
- Delete Button : Permanently removes the survey from the system.
- Edit Button: Opens the edit screen to modify survey details using the same 3-step process.
- Send Notification Button: Sends a reminder to the targeted users to complete the survey.
This button is active (green) if the survey is still ongoing and becomes red/inactive once the end date has passed.
- Preview Button: Allows the admin to view survey content and visual statistics, with options to export the report.
Survey Details Window
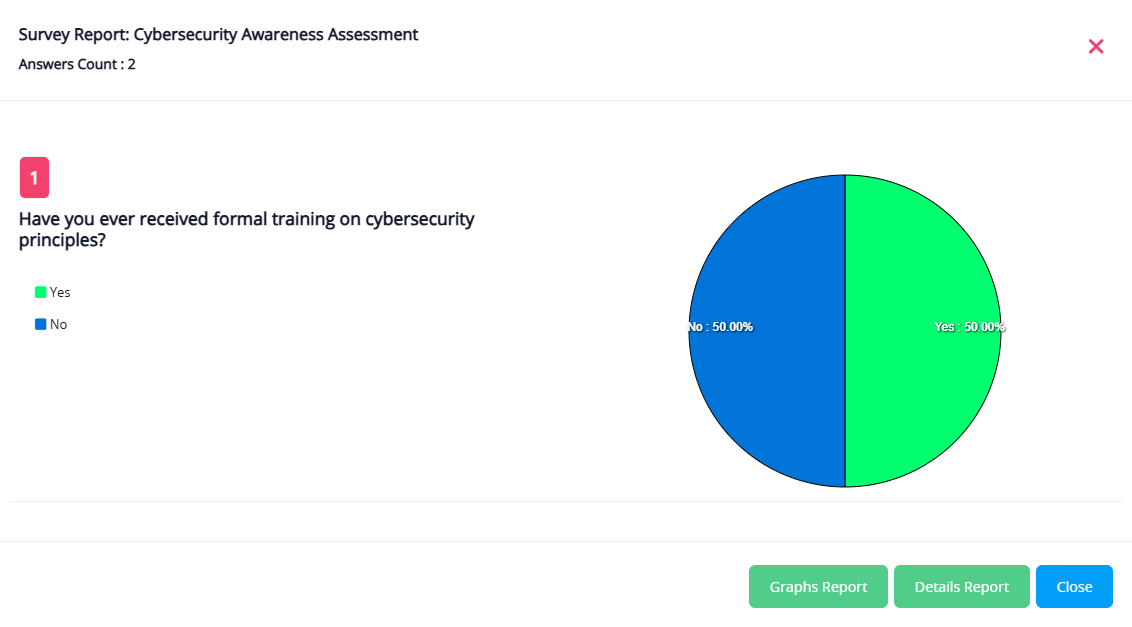
Screen Contents:
- Report Title: Displayed at the top, followed by the number of participants under "Total Responses".
- Chart: A Pie Chart shows the distribution of user responses for each question. Example question: "Have you ever received formal cybersecurity awareness training?" The chart visualizes the percentage of responses (Yes – No) using different colors.
- Legend: Appears next to the chart to explain the meaning of each color (e.g., Green = Yes, Blue = No).
Bottom Buttons:
- Close (Blue Button): Closes the report and returns to the Survey Management screen.
- Detailed Report (Light Green Button): Downloads an Excel file with a table of all participant details and their responses.
- Graphical Report (Green Button): Exports a PDF file containing the visual chart shown on screen.
Additional Notes:
- This screen automatically appears when the "View" button is clicked, making it easy to analyze results.
- Supports multiple questions per survey. If more than one question is included, they are displayed sequentially.
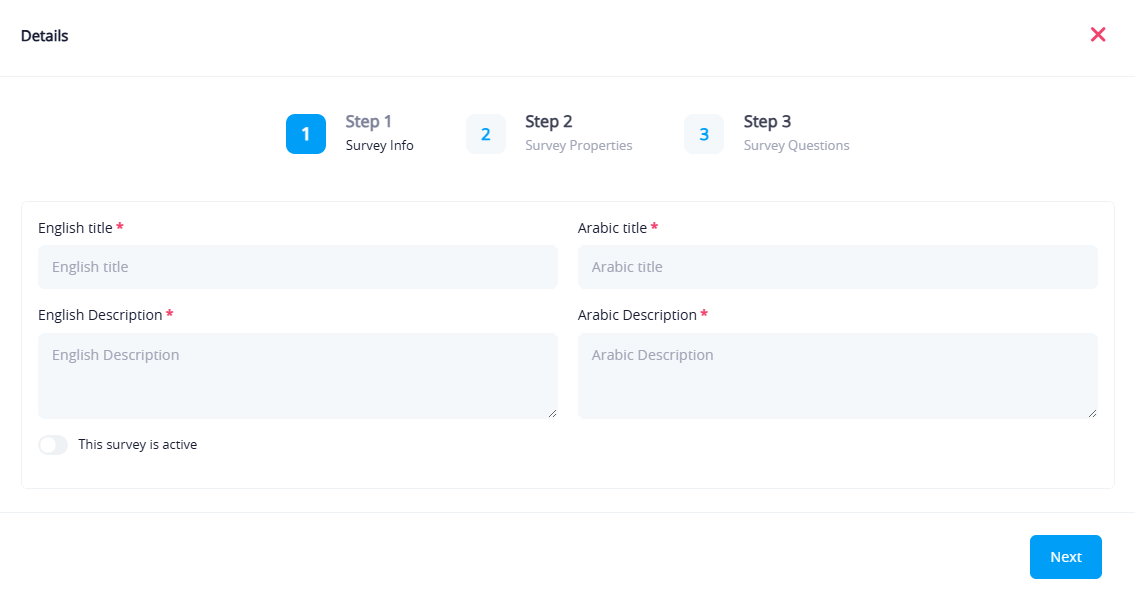
Step 1 – Survey Information Window
This window is used to enter the general information about the survey, including:
- Title in both Arabic and English
- Description in both Arabic and English
- Activation Toggle: To specify whether the survey is currently active
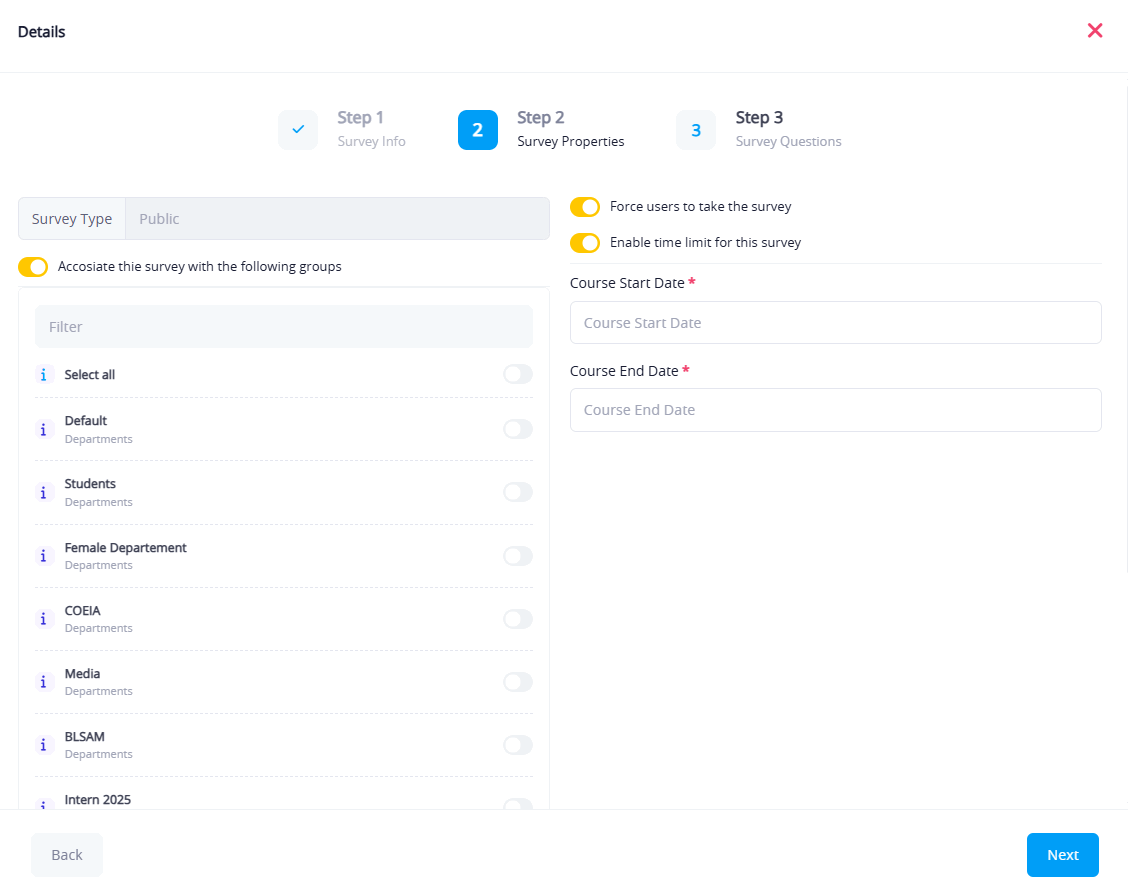
Step 2 – Survey Properties Window
In this step, you define additional properties for the survey:
- Survey Type: General or department-specific
- Select Target Departments: If the survey is set as department-specific
- Start Date and End Date: Define the active period of the survey
- Additional Options:
- Force users to complete the survey
- Specify if the survey has a time limit
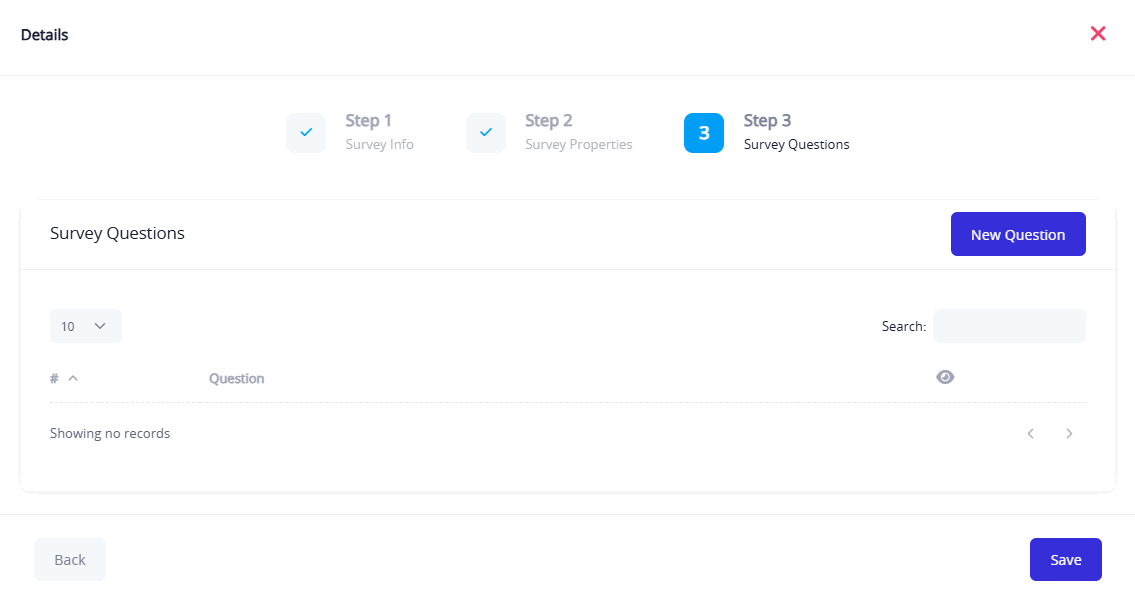
Step 3 – Survey Questions Window
This window displays all questions currently added to the survey.
- Click "New Question" to add a new survey question
- The table lists all existing questions
- A search field allows filtering through questions
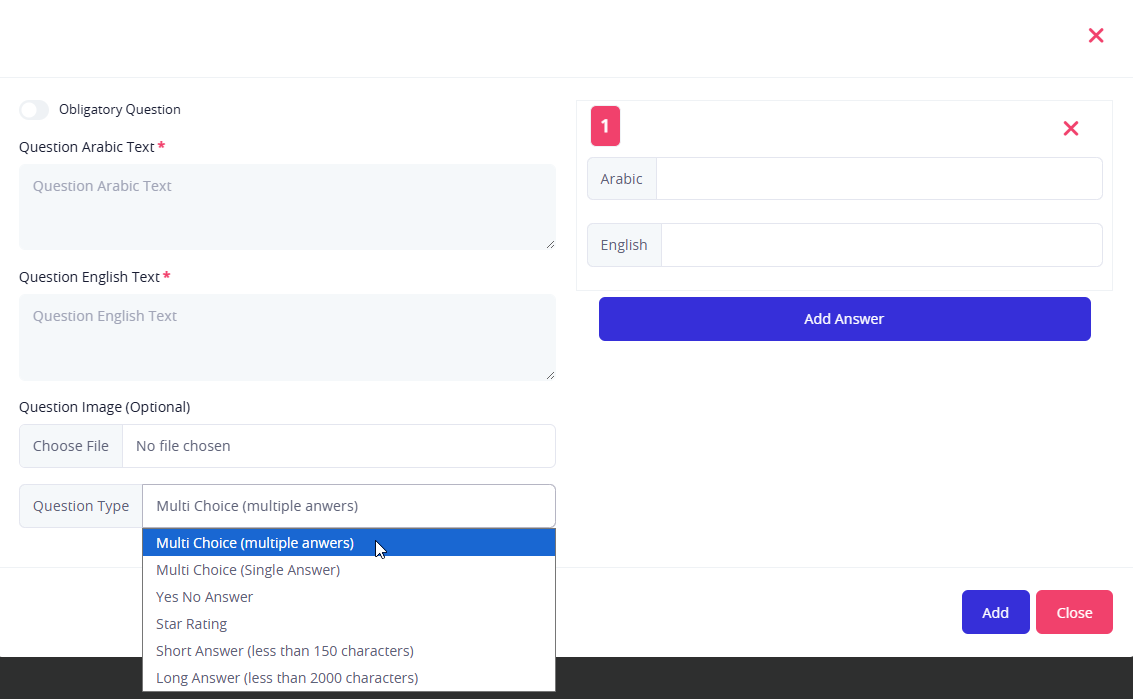
Add Question Window
Used to input the details of the question to be included in the survey.
- Question text in both Arabic and English
- Image Upload (Optional): You can attach an illustrative image to the question
- Question Type: Selected from a dropdown menu, options include:
- Multiple choice (single answer)
- Multiple choice (multiple answers)
- Yes No answer
- Star rating
- Short answer
- Long answer
