General Statistics
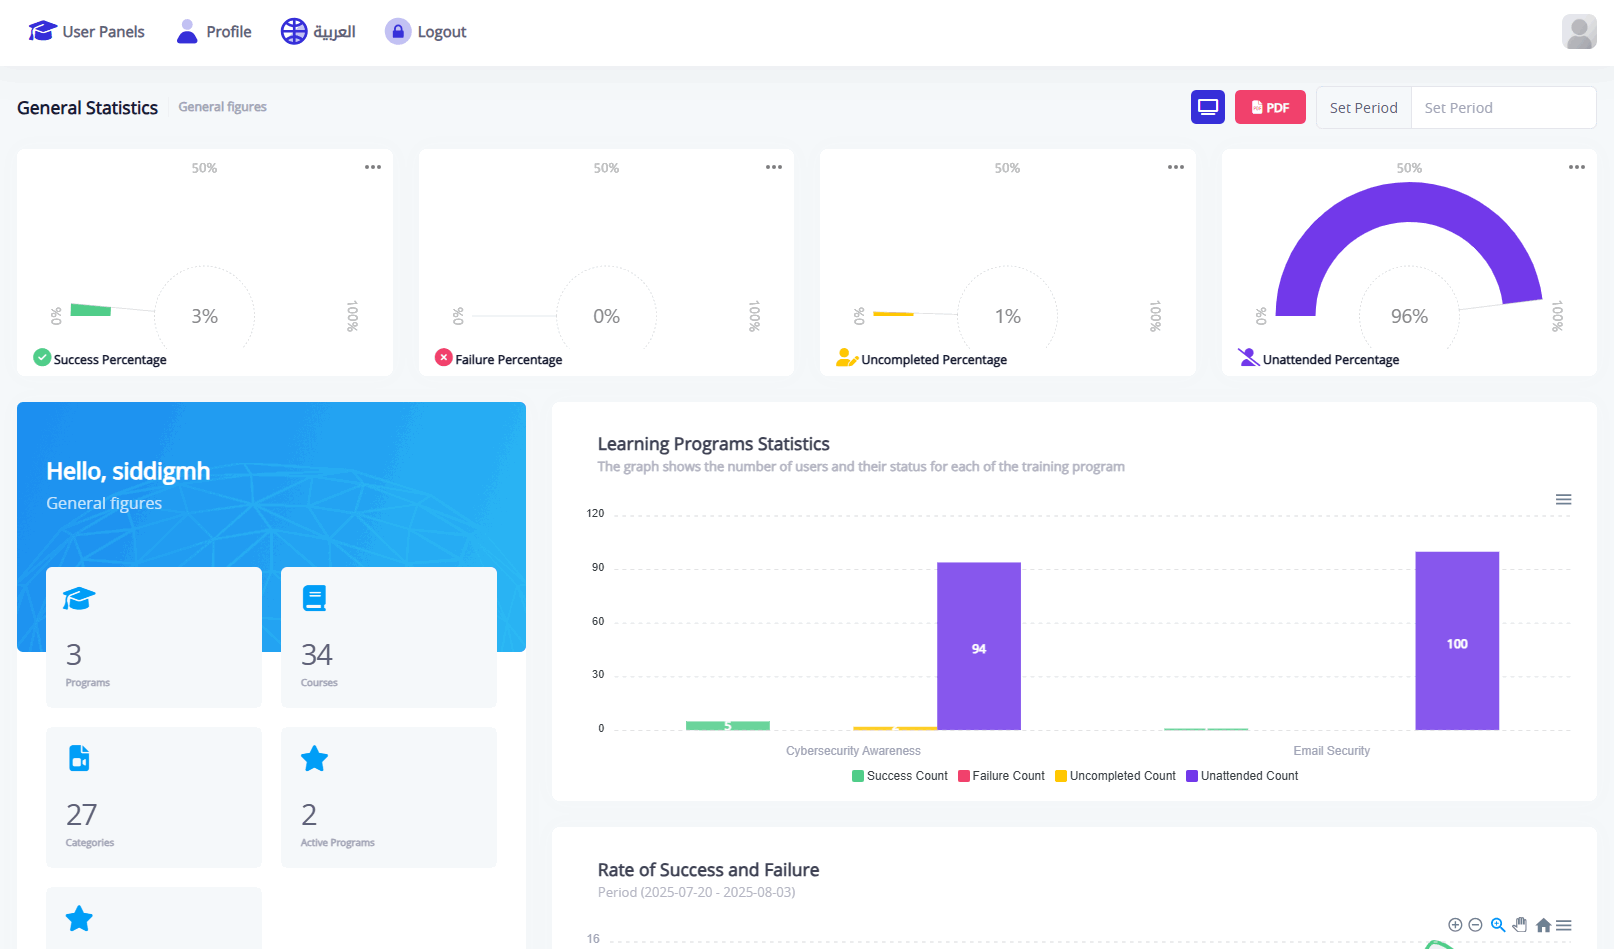
The General Statistics page serves as a comprehensive dashboard for the system administrator, enabling them to monitor the overall performance of users and training programs through precise numerical and graphical indicators. This page acts as a starting point for analyzing engagement with training courses and making quick, effective administrative decisions.
The General Statistics page includes the following elements:
- Performance ratios (attendance, completion, failure, success).
- Graphical indicators for training programs.
- Test analysis and awareness level assessments.
- A summary of the list of programs and topics added to the platform.
After logging in, the system administrator can access the "General Statistics" page under the Statistics section to view key figures and indicators.

Top Navigation Bar
This bar appears at the top of the page and contains the following tools:
| Description | Item |
|---|---|
| A button that allows the user to return to the main dashboard homepage. | User Panels |
| Displays user information (name, email, profile details) with the ability to edit. | Profile |
| A button to switch between Arabic and English interfaces. | Change Language (English) |
| Used to securely log out from the system. | Logout |
Top Control Tools

These tools appear at the top of the Statistics section and are used to control how data is displayed:
| Function | Button |
|---|---|
| Allows selecting a time range (start and end dates) to display statistics within that period. | Select Period |
| Generates a report of the currently displayed statistics in PDF format. | Export PDF |
| Enables "Full Screen" mode to hide side elements and focus on the data. | Full Screen View |
- It is important to ensure that the selected period contains actual data in order to display accurate statistics. The exported PDF report is based on what is currently visible on the screen. This data can be used as a quick reference for decision-making or for preparing periodic reports.
Statistics Display

This section presents a set of key performance indicators related to user engagement across all training programs within the system. The values are updated based on the selected time range. When hovering over any of these boxes, an additional description will be displayed, explaining the meaning of each statistic.
| Description | Statistic |
|---|---|
| The percentage and number of users who have successfully completed the training programs. | Success Percentage |
| The percentage and number of users who failed the training programs (failed one or more course tests within the program). | Failure Percentage |
| The percentage and number of users who did not complete the training programs (did not complete at least one course test). | Incomplete Percentage |
| The percentage and number of users who never attended the training programs (did not start any test on the platform). | Unattended Percentage |
Note: These indicators are automatically updated as soon as the selected time range is changed.
Supplementary Statistics

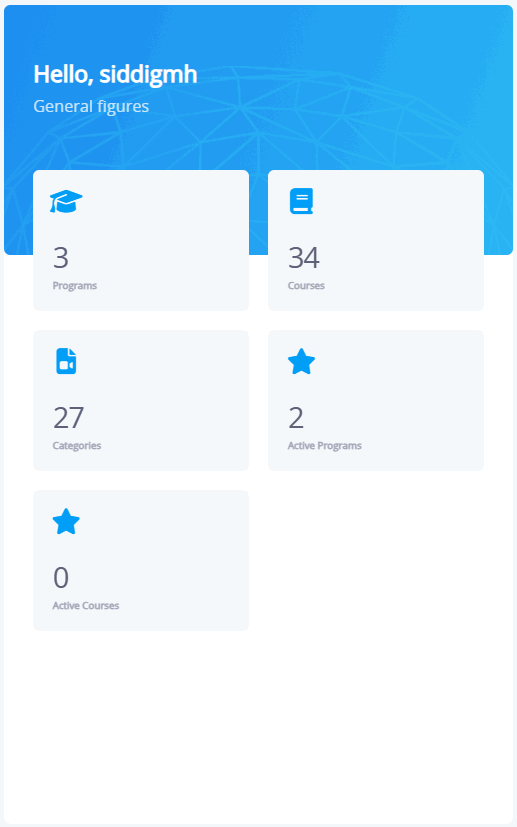
Upon logging into the dashboard, the system administrator is presented with a comprehensive summary panel containing both numerical and graphical data related to training programs, including active programs and added topics in the system. The panel includes the following elements:
| Description | Item |
|---|---|
| Total number of training programs on the platform. | Programs |
| Total number of training courses available. | Courses |
| Total number of topics added to the system. | Categories |
| Number of active training programs accessible to employees. | Active Programs |
| Number of courses that are still open for viewing and assessments. | Active Courses |
Training Program Statistics
- Content: Displays the number of users registered in each active training program in the system, along with their status (Passed, Failed, Absent, Incomplete).
- Chart: A vertical bar chart shows the number of users by status. For example:
- Program: Cybersecurity Awareness Program
- Number of "Absent" users: 85 users
- Legend (Colors):
- Green: Number of users who passed
- Red: Number of users who failed
- Yellow: Number of users who did not complete
- Purple: Number of users who were absent
Pass/Fail Rate
- Description: Displays a numerical comparison between users who successfully passed the program and those who did not, within a specific time period.
- Current Period: From
04-05-2025to18-05-2025 - Chart: In the current example, the number of failed users =
0, meaning there were no actual fail cases recorded during this period.
Each chart includes controls such as zooming, exporting, and display adjustments.
Awareness Test Pass/Fail Trends

This section presents a chart that visualizes participant performance in awareness-level measurement tests. It shows the time-based trend of pass and fail counts for each measurement test individually.
Chart Components:
| Description | Element |
|---|---|
Defines the time frame for the displayed data. Example: From 2024-11-06 to 2024-12-03. | Time Period |
| Represents the number or rate of users who failed the measurement test. Displayed as a downward red line. | Red Line (Failed) |
| Indicates the number or rate of users who passed the test, also shown as a lighter downward line. | Green Line (Passed) |
Each point on the horizontal axis is labeled by test attempt or batch, such as: test1 - 03-12-2024 or Trial 2 - 20-11-2024. | Measurement Tests |
| Located in the top-right corner and allows zooming, downloading data, and changing the view style. | Interaction Tools |
Training Program Details

This table displays summarized data for each training program in the system and includes the following columns:
| Description | Column |
|---|---|
| Program name, e.g., "Cybersecurity Awareness Program". | Program Name |
| The time period covered by the training program. | Start / End Date |
| The number of courses associated with the program. | Number of Courses |
| The number of departments/groups assigned to the program. | Departments / Groups Count |
| The final result of users after completing all tests. | Passed / Failed Count |
| The number of users who failed or did not participate in any test. | Failed and Absent Count |
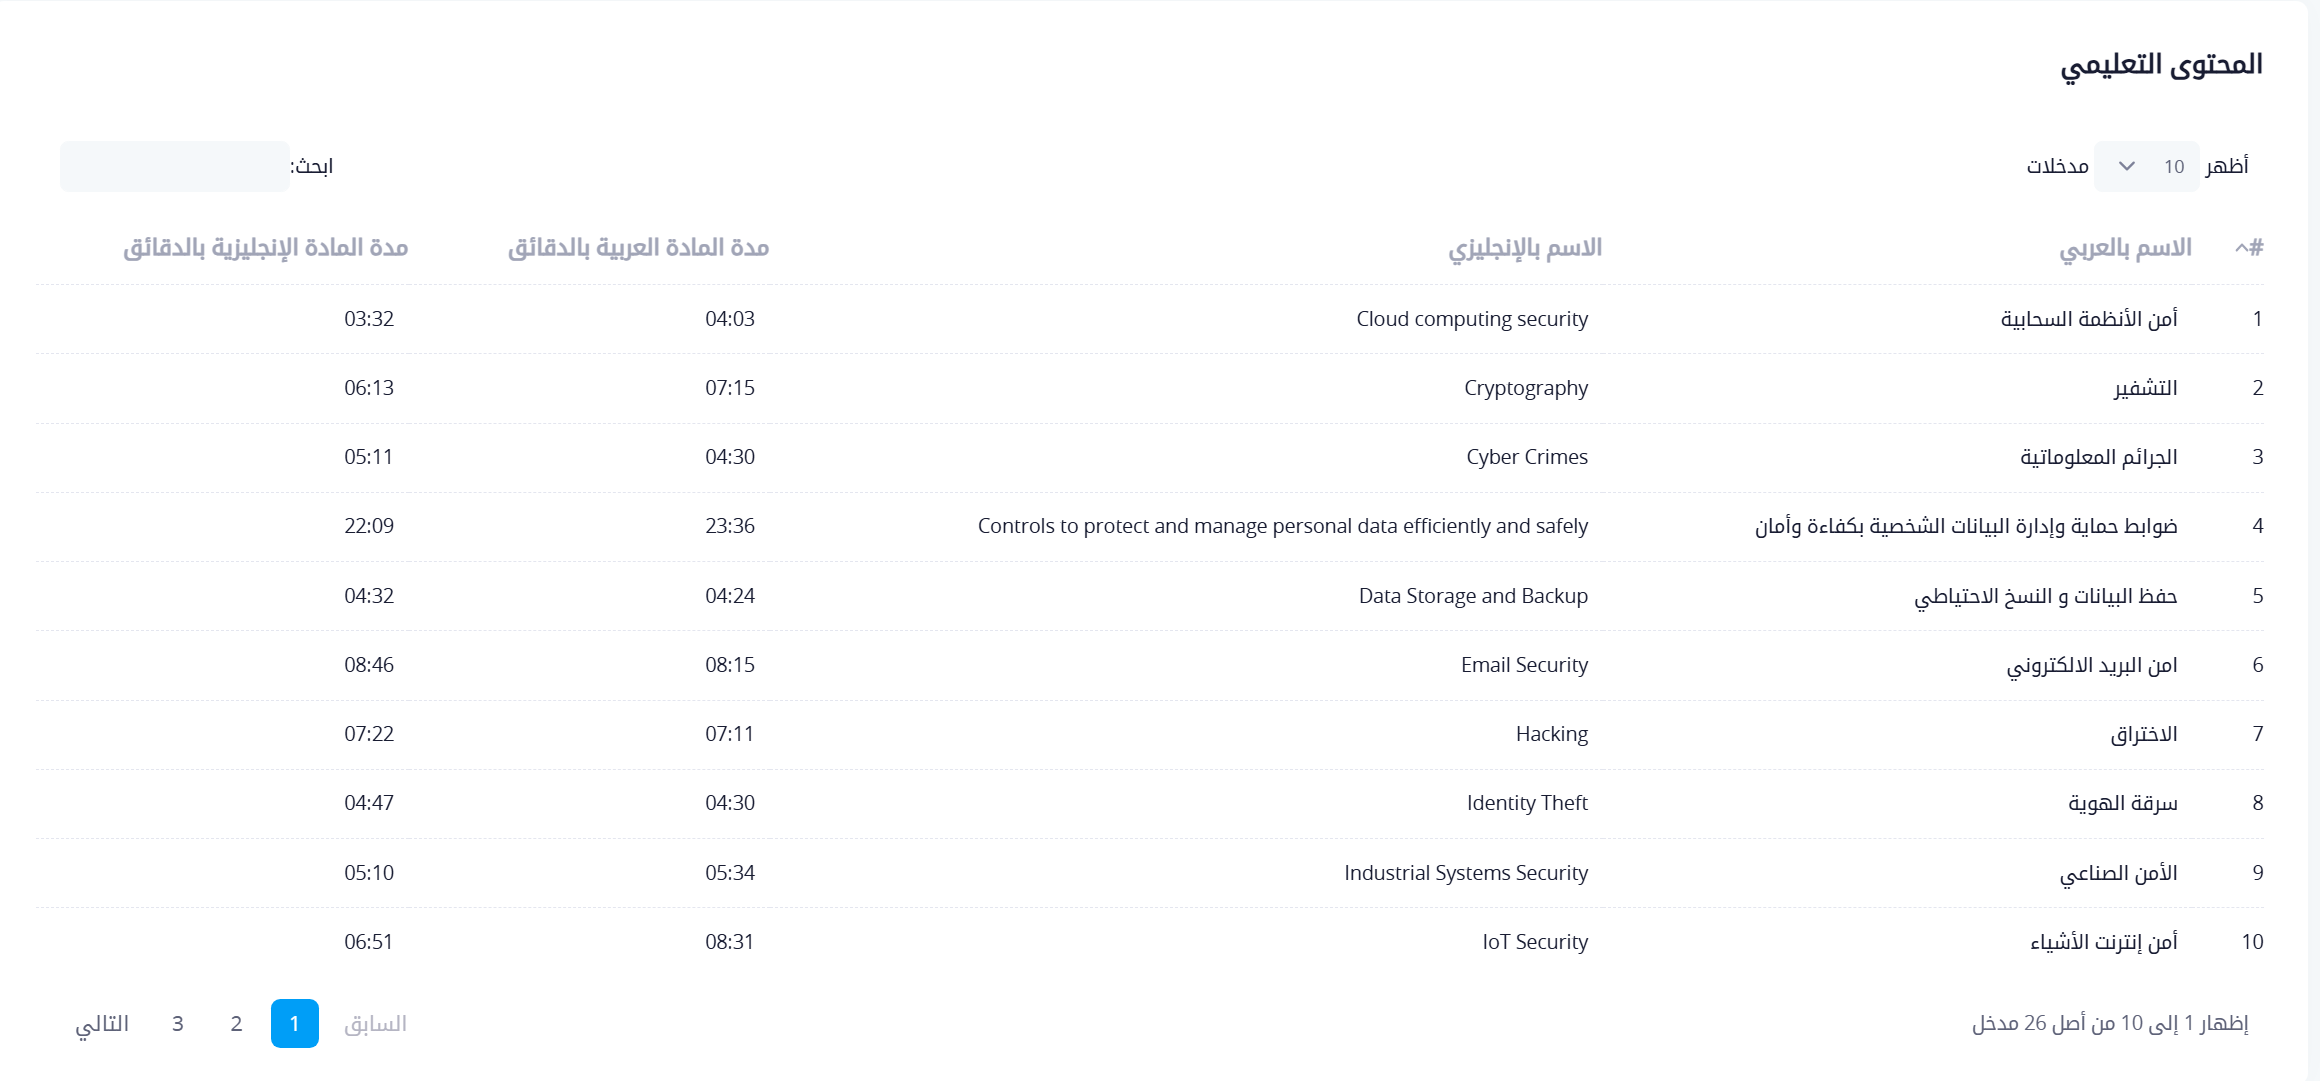
Educational Content

This table lists the topics used within the training courses, helping to identify the total number of topics on the platform and the duration of each one.
| Description | Column |
|---|---|
| Serial number of the content item. | Number |
| Topic name (e.g., Cloud Computing Security). | Name (Arabic / English) |
| Time required to study or watch the topic in each language, shown in minutes and seconds. | Duration (Arabic / English) |